Visualise Google Sheet Data in Apache Superset

In this blog post, we will visualize data from a Google Sheet and create charts in Apache Superset. We will also add these charts to a dashboard.
Let's dive in! 🚀
For this guide, we'll use a popular IMDB Top 1000 Movies dataset from Kaggle.
File > Import > Upload).Share button in the top right, and change the setting to Anyone with the link can view Copy the shareable link.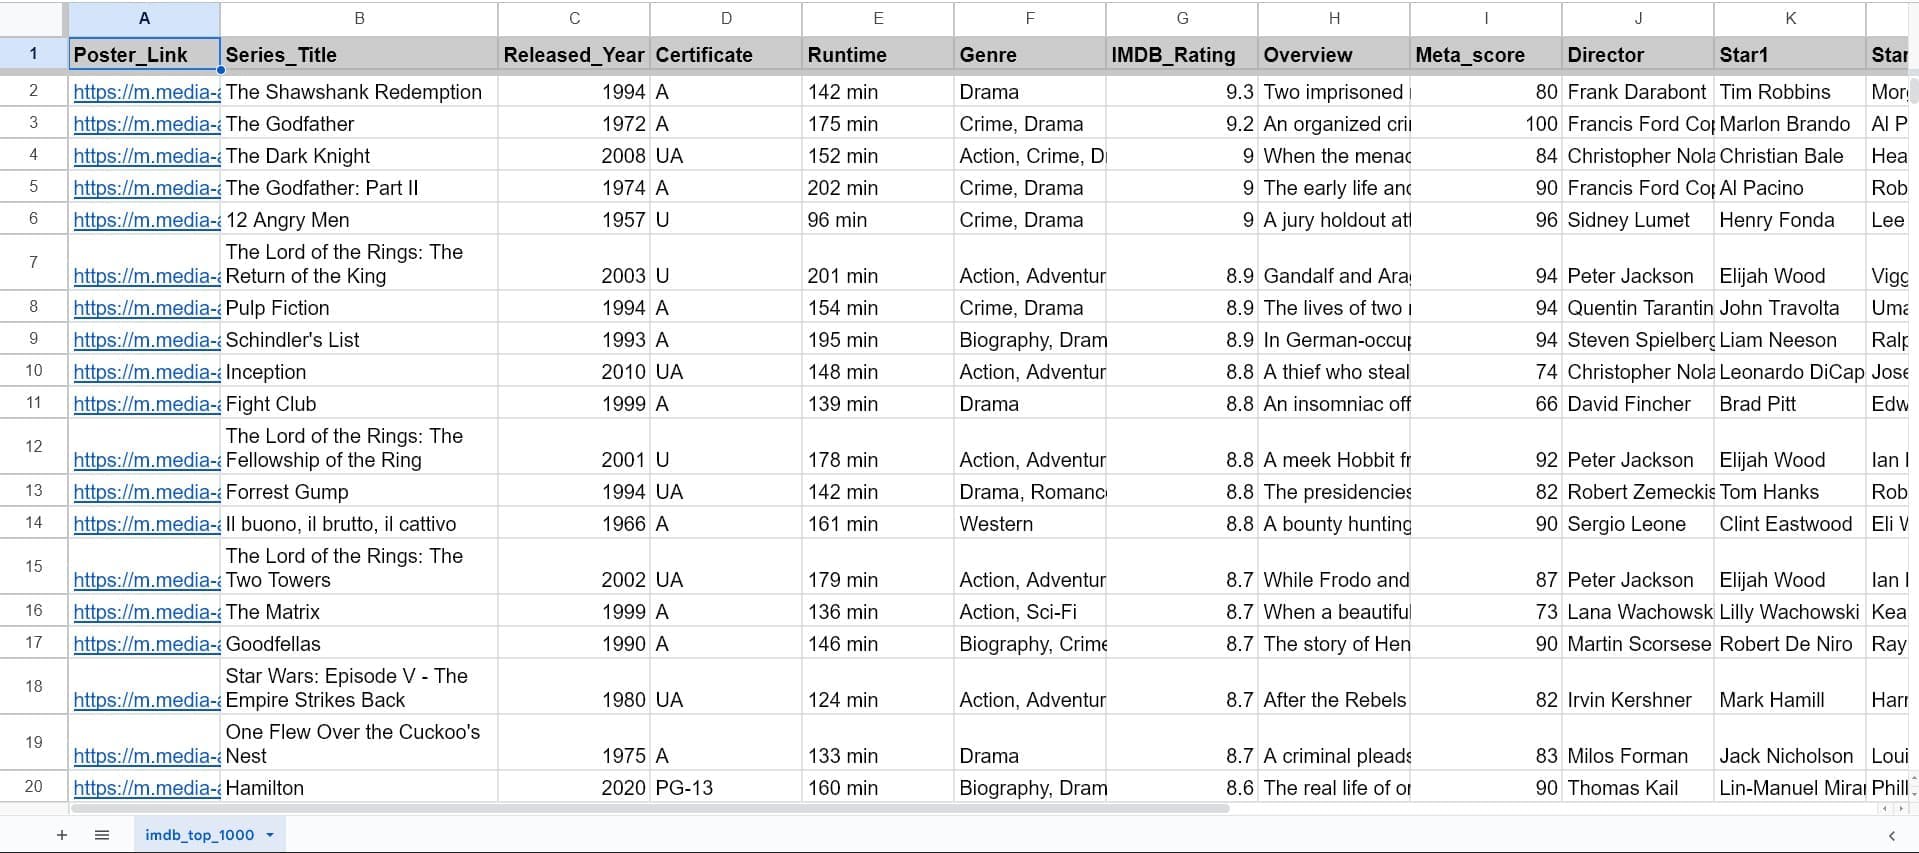
In the Superset interface, click the + icon in the top-right menu.
From the drop-down, select Data and then Connect Google Sheet.

A pop-up window will appear. Paste the shareable Google Sheet URL you copied earlier into the "URL" field. Give your connection a clear "Database Name" (e.g., "IMDB Movie Data GSheet").

Click Connect.
Verify the connection: To make sure it worked, you can navigate to Settings > Database Connections. You should see your new "IMDB Movie Data GSheet" connection listed.

Navigate to the Datasets tab (you might find this under Data > Datasets).
Click the + Dataset button in the top-right.
In the "Create a new dataset" screen:
Superset will load all the columns from your sheet, along with their data types.
Click the Create Dataset and Create Chart button at the bottom.

Select your Dataset: If you weren't redirected, go to Charts > + Chart. Select the new "IMDB Movie Data" dataset you created in Step 2.
Choose a Visualization Type: Select the "Table Chart" visualization.

In the "Data" tab, you have two main sections: Dimensions and Metrics.
Add Dimensions: Drag columns like Series_Title, Released_Year, and Genre from the "Columns" list on the left into the Dimensions box.

Add Metrics: Let's find out the highest-grossing movies.
Gross column into the Metrics box.SUM label to edit the aggregate. Change it to MAX. 💰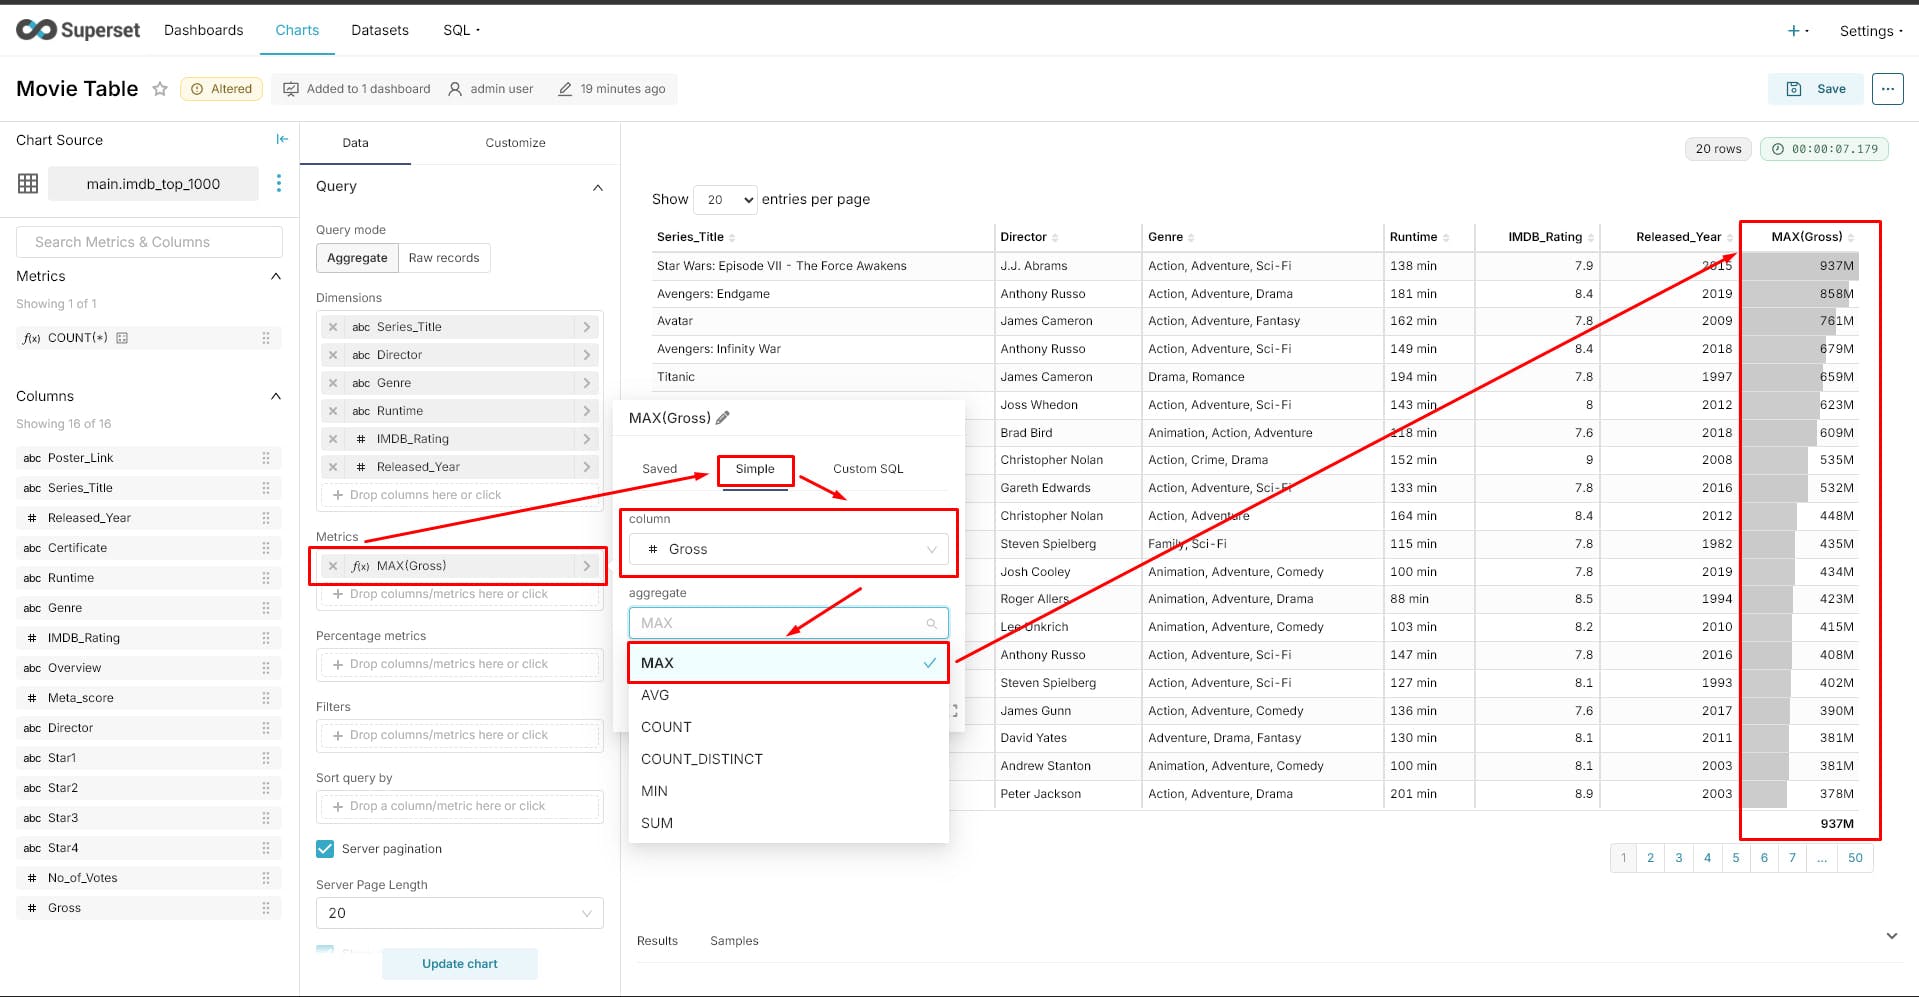
Add More Metrics: Let's also see the number of votes.
No_of_Votes column into the Metrics box. The default SUM is fine here, or you could use MAX as well. 🗳️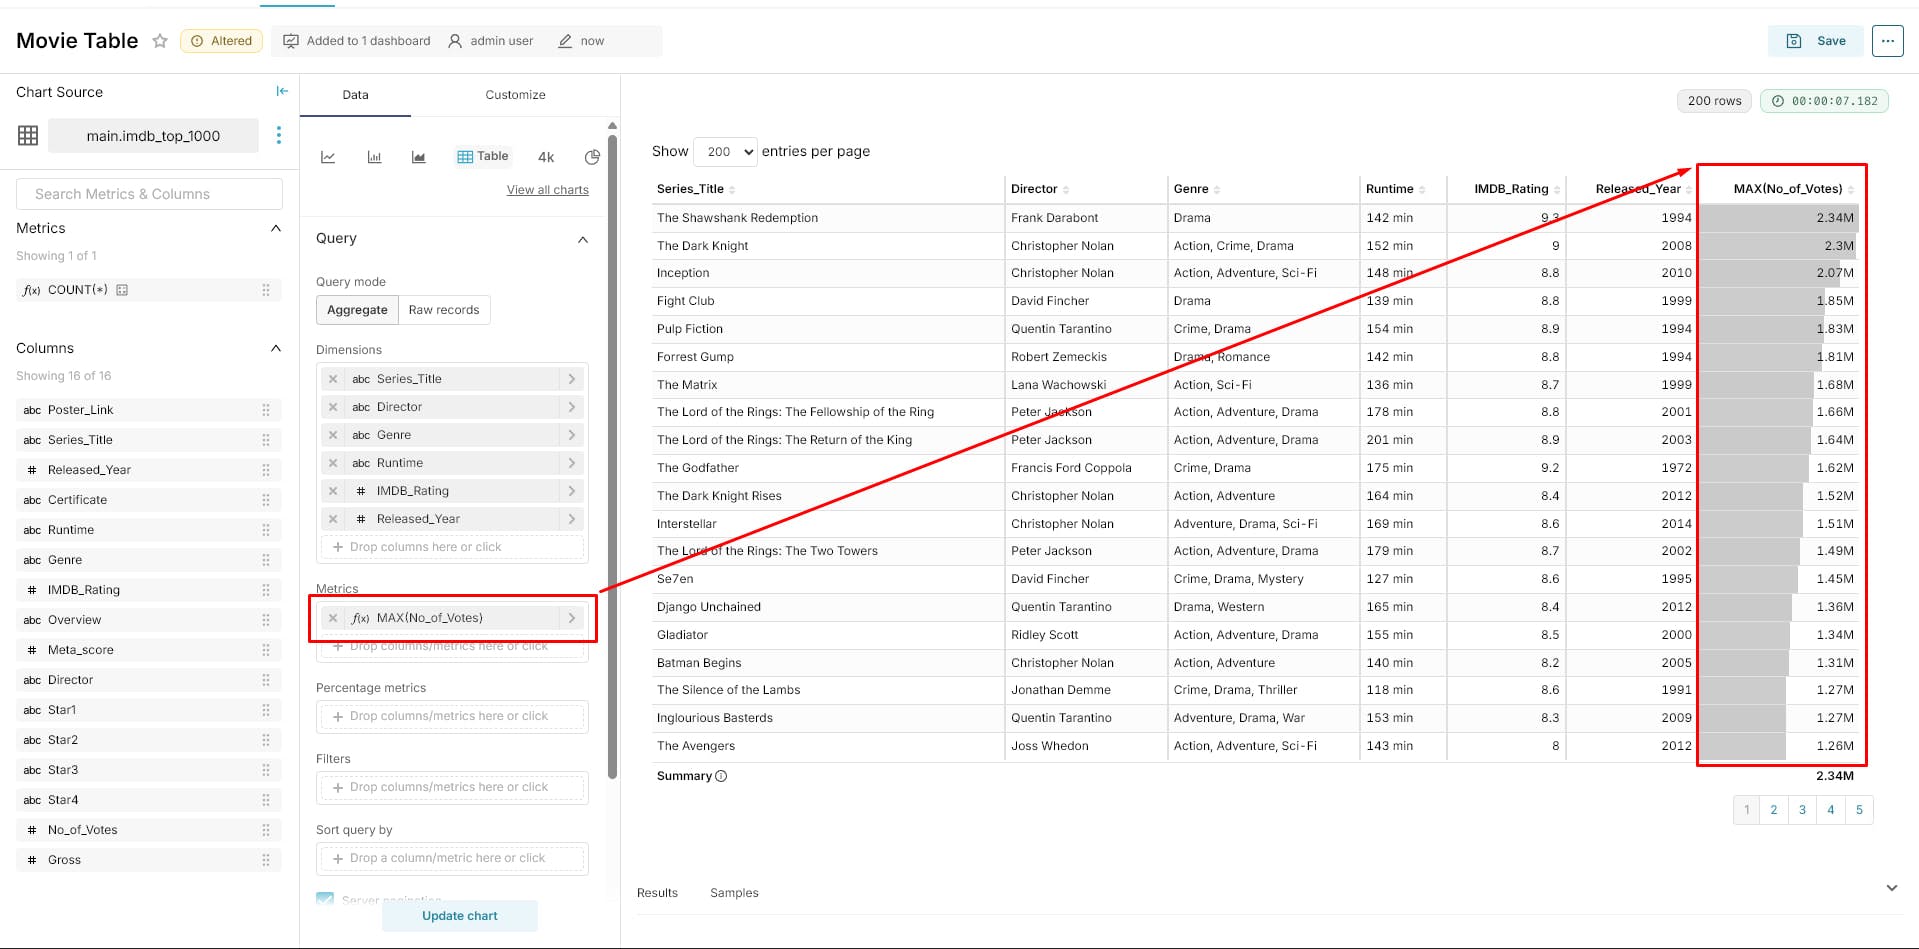
Update the Chart: Click the Update Chart button. You'll see your table populate on the right with the data directly from your Google Sheet!
Once your chart looks good, you'll want to save it and add it to a dashboard.
Save button near the top-left of the Explore view.Save & Add.
Stuck with SQLite errors in Superset? Learn why your metadata DB is locked and how to fix it permanently by migrating to PostgreSQL.
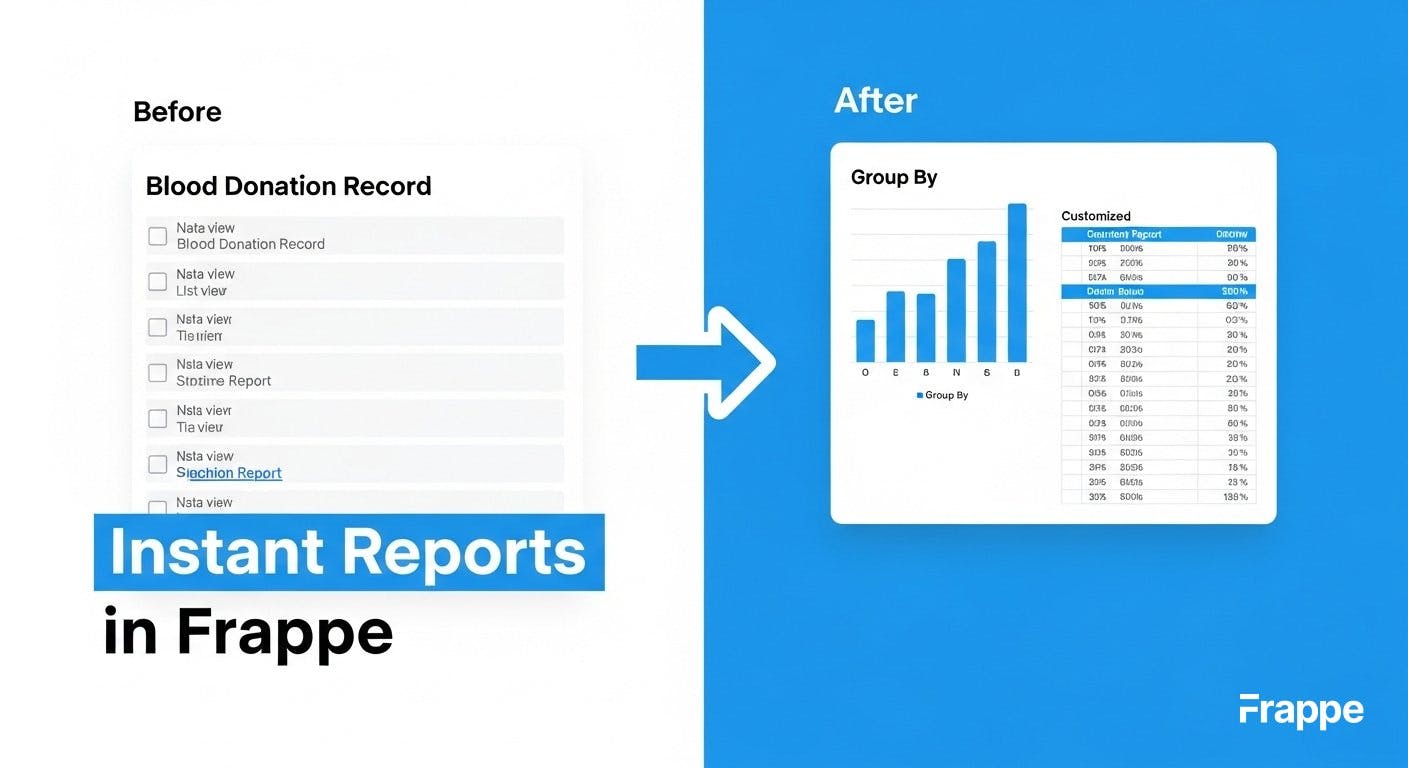
Learn why the Frappe framework's built-in reporting is a game-changer. See how to customize, group, and save reports instantly

Unlock advanced features in Apache Superset. Learn to set Feature Flags, customise themes, and apply config changes in your Docker setup